In today’s increasingly digital world, databases serve as the foundation for running modern applications. Whether you manage an eCommerce platform, financial software, or a Content Management System (CMS), ensuring the smooth operation of your database is crucial. This is where the importance of database monitoring comes into play. By continuously tracking database performance, administrators can detect issues early, optimize resource allocation, and enhance reliability.
This blog highlights database monitoring and its metrics for enterprise applications, a solid grasp of database monitoring not only helps in maintaining peak performance but also supports business continuity by preventing costly downtime and improving overall system efficiency.
What is Database Monitoring?
Database monitoring can be defined as the practice of tracking the status of the various databases in an organization on an ongoing basis. This includes log analysis, search for possible bottlenecks in databases if the database is performing optimally. It goes beyond merely identifying problems once they occur; it is the early identification of potential issues and timely action to ensure that they do not occur at all.
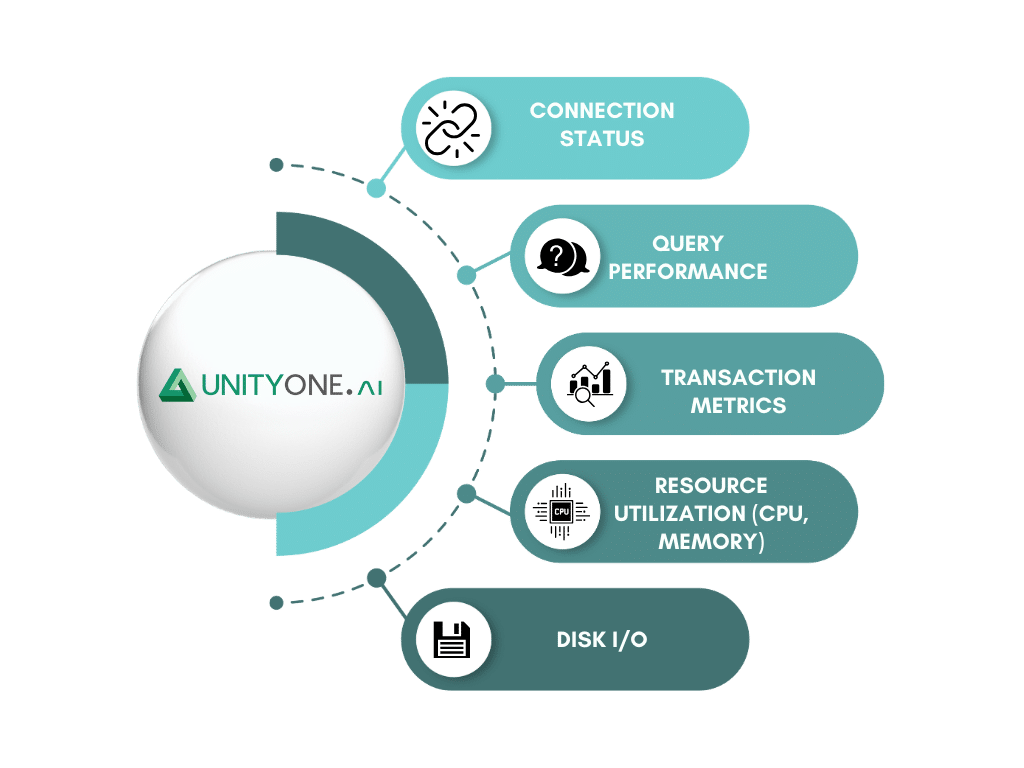
Let’s get started with the five critical performance indicators that every Cloud DBA or developer needs to pay attention to if they have to maintain their databases in the best state possible.

1. Connection Status
Connection status is a fundamental metric that provides insights into how many active connections are currently established with the database. Monitoring this metric helps in understanding the load on the database and identifying potential issues such as connection leaks, where connections are not properly closed, leading to exhaustion of available connections.
High connection counts can indicate that the application is under heavy load or that there is inefficient connection management within the application. Conversely, a low number of connections might suggest that the database is underutilized or that users are experiencing issues connecting to the database.
2. Query Performance
Query performance is arguably the most critical metric for assessing database health. Slow or poorly optimized queries can lead to delays, timeouts, and poor user experience. Monitoring query performance involves tracking the execution time of queries, identifying long-running queries, and analyzing query plans to ensure they are efficient.
Regularly reviewing slow query logs and using performance analysis tools can help in optimizing queries and improving overall database performance.
3. Transaction Metrics
Transactions are the foundation of data integrity in databases, ensuring that operations are completed fully or not at all. Monitoring transaction metrics involves tracking the number of transactions, the success/failure rate of transactions, and the time taken to complete transactions.
Transaction metrics are critical for understanding the throughput of your database and ensuring that it can handle the load. High transaction rates with low failure rates indicate a healthy, high-performing database. Conversely, high failure rates or slow transaction processing times can indicate underlying issues, such as locking problems, deadlocks, or resource contention.
4. Resource Utilization (CPU, Memory)
Resource utilization metrics provide insights into how much of the server’s CPU and memory resources are being consumed by the database. Monitoring CPU and memory usage helps in identifying resource bottlenecks and ensuring that the database is not overburdened.
High CPU usage can indicate the database is processing many complex queries or that there is insufficient indexing. Memory usage is equally important, as insufficient memory can lead to increased disk I/O, which can slow down query performance. Tools like top in Unix-like systems or database-specific monitoring tools like Oracle Enterprise Manager can provide real-time insights into resource usage.
5. Disk I/O
Disk I/O is a critical metric that measures the rate at which data is read from and written to disk. Since databases frequently read from and write to storage, monitoring disk I/O is essential to understanding the performance of the database’s storage subsystem.
High disk I/O can indicate that the database is performing a lot of read/write operations, which can lead to increased latency, especially if the storage subsystem cannot keep up. It’s important to ensure that disk I/O is within acceptable limits and that there are no bottlenecks, such as slow disks or fragmented data.
The Role of UnityOne.ai in Database Monitoring
Though it is possible to monitor these metrics on your own, or with traditional means, today’s large databases and their intricacy may require more detailed analysis. This is where having a centralized database monitoring tool like UnityOne.AI comes in handy.
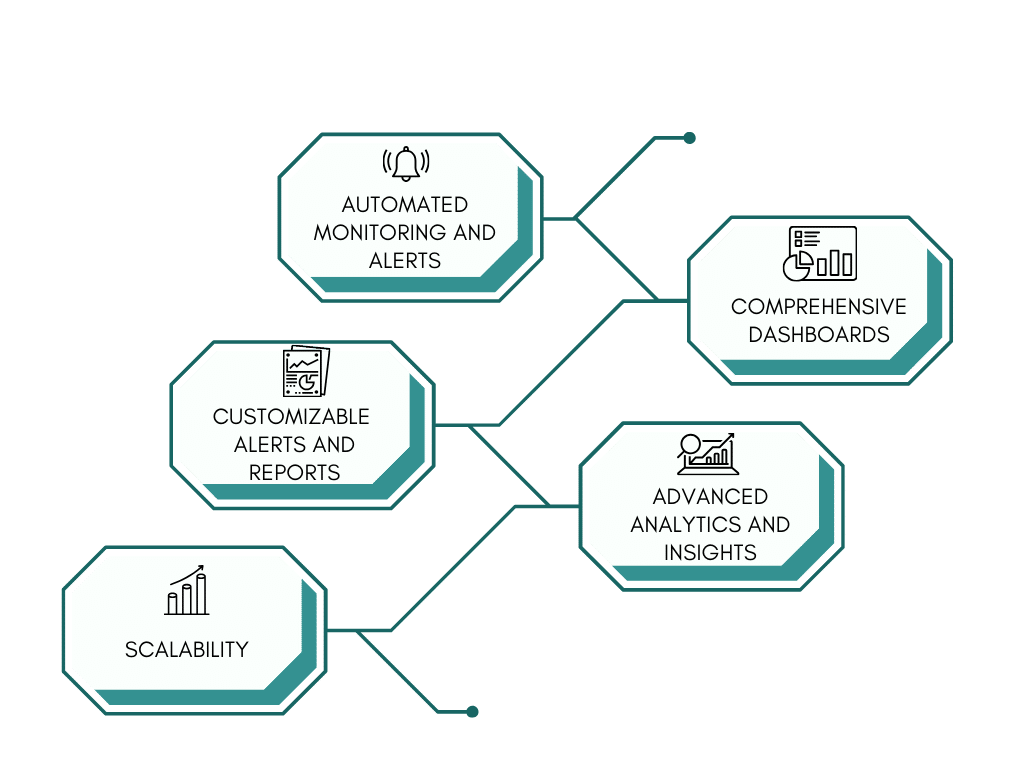
UnityOne.ai provides an all-in-one platform that simplifies the monitoring process by automatically collecting and analyzing key database metrics in real-time. It offers several advantages:

1. Automated Monitoring and Alerts: UnityOne. ai works in the background to track changes made in your database and notify you of any upwards shifts or potential problems that may emerge.
2. Comprehensive Dashboards: Generates reports and consoles showing the overall state of your database, connections, queries, transactions, loads on hardware resources, and disk I/O rates without managing multiple windows.
3. Advanced Analytics and Insights: Produces graphs and charts in analysis, enabling you to make sound decisions on database connection, usage and availability and performance.
4. Customizable Alerts and Reports: You can specify prescriptive thresholds and configure the application to notify you about merely those problems that you care about within your environment.
5. Scalability: As the number of records in your database increases, UnityOne. ai scales without any problems, meaning that you can manage several databases in different environments in parallel with increase in productivity and accuracy of results.
Incorporating a tool like UnityOne.ai into your database monitoring strategy not only streamlines the process but also provides you with deeper insights and greater control over your database environment.
Conclusion
Effective database monitoring is vital for maintaining the performance, reliability, and efficiency of your database systems. By focusing on these five key metrics—connection status, query performance, transaction metrics, resource utilization, and disk I/O—you can proactively identify and resolve potential issues before they impact your application. Tools like UnityOne.ai can significantly enhance your monitoring efforts, providing real-time insights, automated alerts, and advanced analytics that help you stay ahead of potential problems.


