

Enhancing Network Visibility with Advanced Network Visualization Tools
Introduction to Network Visualization: A Critical Need
As modern IT environments grow more complex, managing an organization’s network infrastructure becomes increasingly challenging. For IT professionals, understanding the flow of data and the performance of each component is vital to maintaining uptime and efficiency. Network visualization tools have emerged as critical assets, enabling teams to visually map, monitor, and analyze network performance in real time. In this blog, we’ll explore how network visualization can transform the way businesses monitor their network, helping to ensure optimal performance and prevent downtime.
Understanding the Core of Network Visualization
At its essence, network visualization is the process of graphically representing a network’s devices, connections, and performance metrics. These tools create interactive maps and dashboards that provide an overarching view of the entire network ecosystem—from routers and switches to load balancers and firewalls. virtual machines and applications.
With proper visualization, IT teams can instantly identify issues, track traffic, and analyze data patterns. As hybrid environments become the norm, visualizing multi-cloud infrastructures, as provided by platforms like UnityOne.AI, allows seamless control and monitoring.
Key Components of UnityOne.AI’s Effective Network Visualization
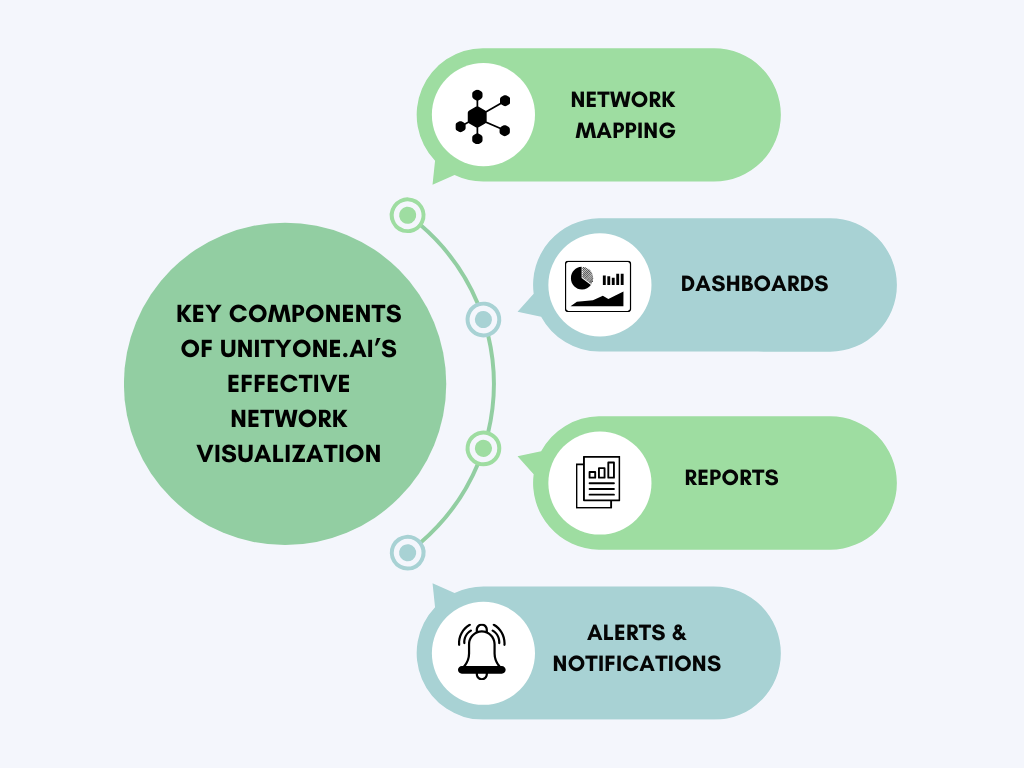
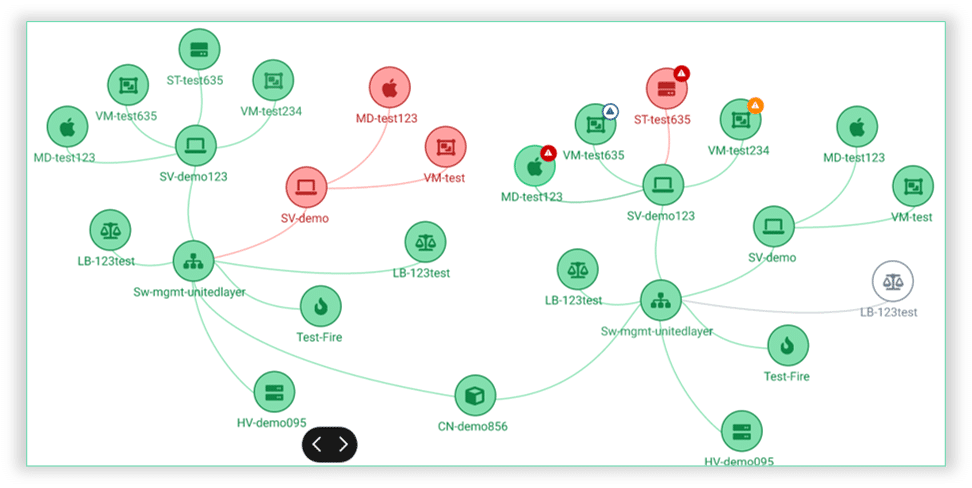
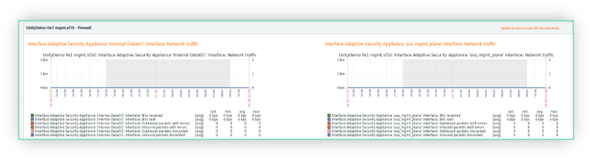
1. Network Mapping: This involves creating a real-time, graphical layout of the network, showing all devices, connections, and relationships.
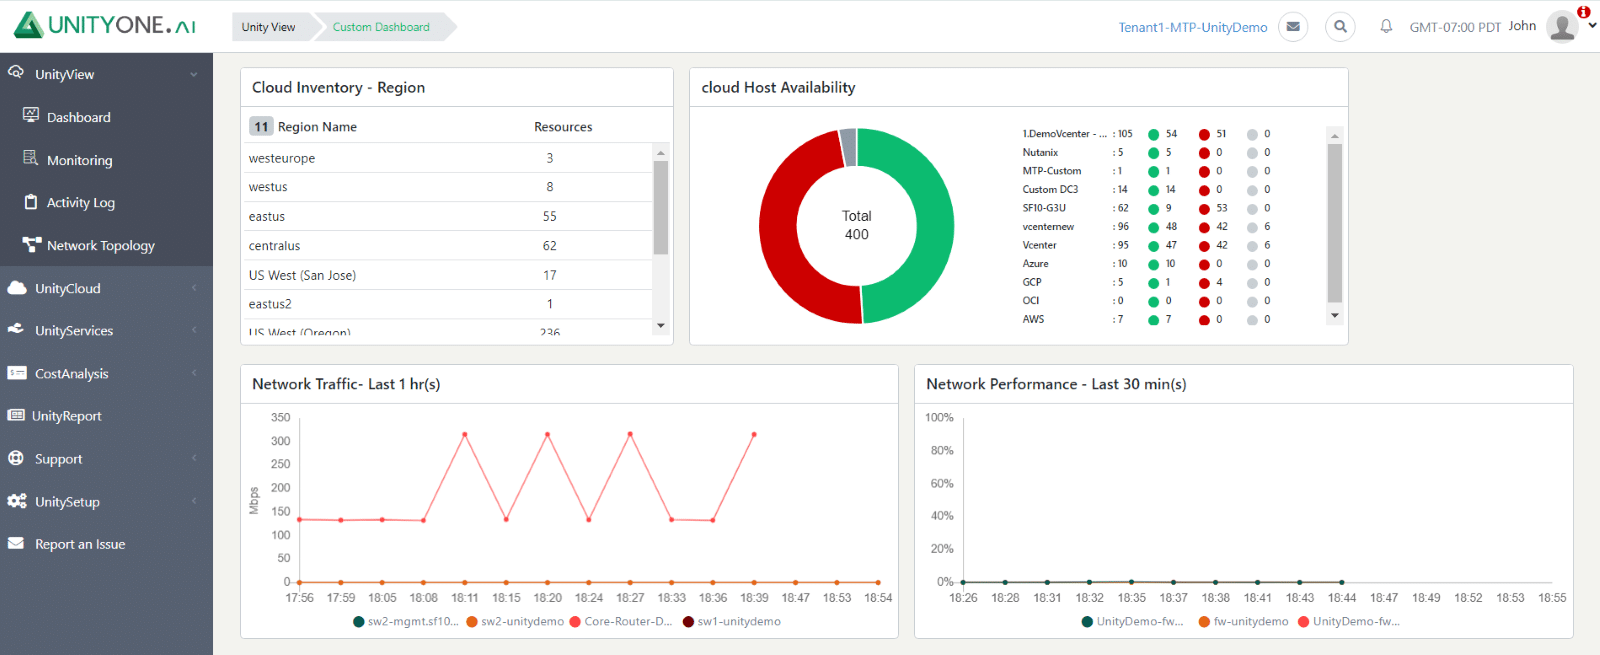
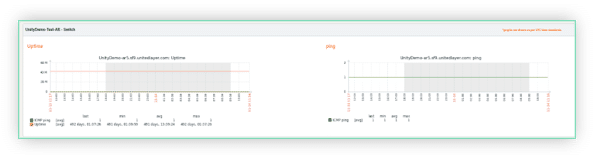
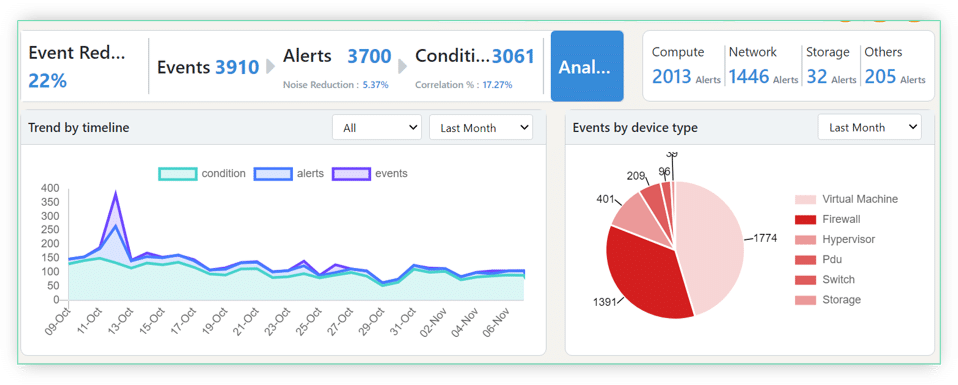
2. Dashboards: Dashboards provide a bird’s-eye view of the network’s performance, highlighting important metrics such as uptime, latency, bandwidth usage, and server health.
3. Reports: Automated, customizable reports enable teams to extract actionable insights based on historical data, which can then inform future network optimization strategies.

4.Alerts & Notifications: A good network visualization tool offers real-time alerts for unusual traffic patterns or potential issues, enabling proactive intervention before they escalate.
Related Blog: How Network Monitoring And Management Can Empower Business Transformations
Real-Time Monitoring: Staying Ahead of Network Issues
Real-time monitoring is the foundation of an effective network visualization strategy. When every device, connection, and application is continuously tracked, IT professionals can respond instantly to emerging issues. Imagine an enterprise’s critical server experiencing a bandwidth spike—without real-time monitoring, this could go unnoticed until a significant slowdown occurs. But with an advanced visualization tool, these anomalies are immediately flagged, allowing for instant troubleshooting.
Visualization Dashboards: Simplifying Complex Data
Dashboards are an indispensable part of network visualization tools, presenting complex performance data in a user-friendly format. Customizable and intuitive, these dashboards allow IT professionals to view important metrics like network uptime, latency, and traffic volume immediately.
With UnityOne.AI’s customizable dashboards, users can set up specific views depending on their role such as network administrators who might want to focus on uptime and traffic.
The Role of Automation in Network Mapping
Automation is transforming the way networks are mapped and monitored. Instead of relying on manual intervention to detect changes in the network, modern visualization tools automatically update maps as new devices or services are added. This ensures that the network map is always current, even in fast-changing environments where hybrid cloud setups and software-defined networking (SDN) have made network landscapes more dynamic than ever before.
Automation also extends to alerting systems. With AI-based anomaly detection, network visualization tools can identify abnormal patterns that might go unnoticed by human observers. This added layer of intelligence makes proactive network management more effective and efficient.
Choosing the Right Network Visualization Tool
Selecting the right network visualization tool depends on the unique needs of your organization. Look for a solution that provides scalability, ease of use, and compatibility with your existing infrastructure. UnityOne.AI, for example, offers robust visualization tools for managing multicloud environments, delivering comprehensive insights into hybrid infrastructure performance.
Getting Started With UnityOne.AI’s Network Visualization Tools
Ready to take your network monitoring to the next level? Getting started with UnityOne.AI’s network visualization tools is easy. Simply sign up for a free trial, and you’ll have access to our full suite of network monitoring and visualization features. Our intuitive interface and comprehensive support resources will help you get up and running in no time.

